Current Biology article published
Glad to share our work in @CurrentBiology comparing the fossil record & molecular phylogeny for Mammalia over last 100-million yrs. We find that the extant phylogeny misses extinctions 66-56 Mya, but is remarkably reliable from 10 Mya to the present-day.
PDF: authors.elsevier.com/a/1dUcI3QW8Rwp…
DOI: https://doi.org/10.1016/j.cub.2021.07.012
Tweet-storm: twitter.com/n8_upham/…

|
To understand what we found, lets back up to what biologists mean by the “Tree of Life”: ancestor-to-descendant relationships reconstructed through time, but also lots of extinction along the way.
As this simulation shows, its really the “Tree of Life & Death” (& taxes!)
Thoughtful people long knew that extinct lineages were ignored when reconstructing trees of life (phylogenies, called ‘timetrees’ when time-calibrated), but nevertheless we’ve tried to find creative ways to query deep time despite sampling bias
Then came Louca & Pennell 2020, which demonstrated that — in the absence of additional fossil or demographic information, any given timetree may be equally explained by an infinite number of diversification scenarios.

|
The mammal fossil record clearly captures a spike in origination after the K-Pg boundary (66 Ma) and then a bigger spike in extinction prior to the Paleocene-Eocene Thermal Maximum (PETM) – the result is that 2/3 of these Paleocene taxa did not leave modern descendants!

|
So, how in the heck can we use extant timetrees to query ancient patterns of diversification around the famous K-Pg mass extinction? Our answer: we cannot. The ‘pulling’ bias of unsampled extinctions is too much. Timetrees need to sample fossils to query deep time.

|
Does that mean timetrees carry no information? NO!
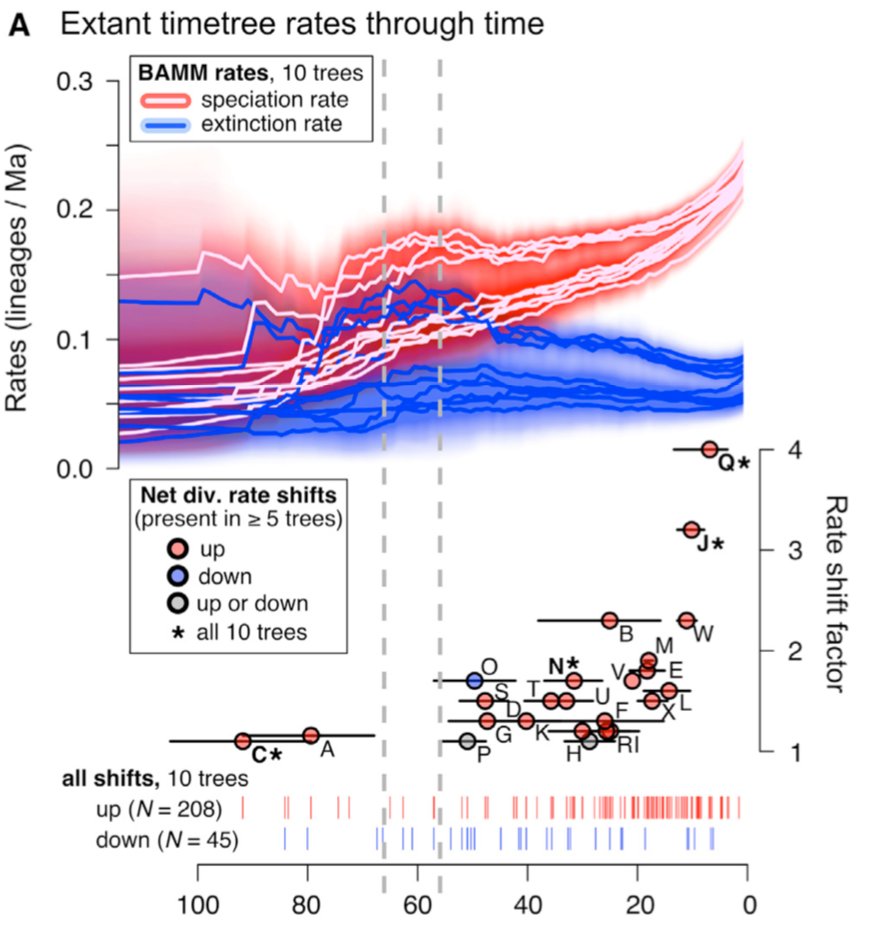
The timetree signal is progressively less biased toward the present, as the increasingly reliable signal of rate-regime shifts also shows – we find the biggest shifts in Ctenomys tuco-tucos (Q) and Pteropus flying foxes (J)
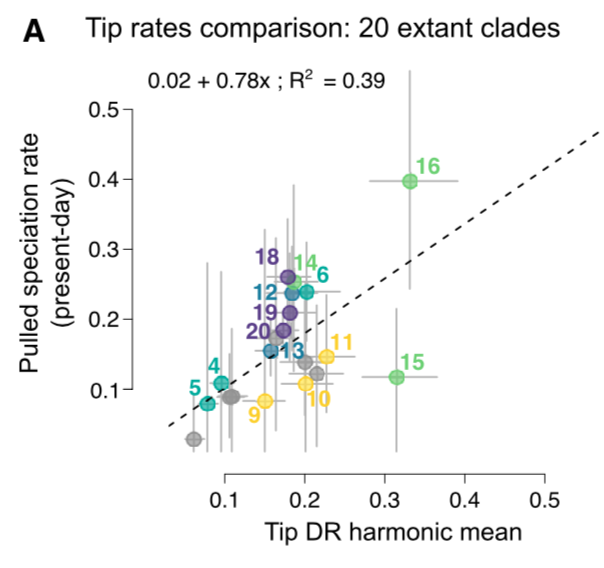
Even cooler, those pulled speciation rates are comparable to species-level ‘tip rates’ of speciation when summarized at the clade level (numbers correspond to Fig 1 clades).
Bonus: Tip rates are easy to calculate when a timetree is sampled for all modern species.
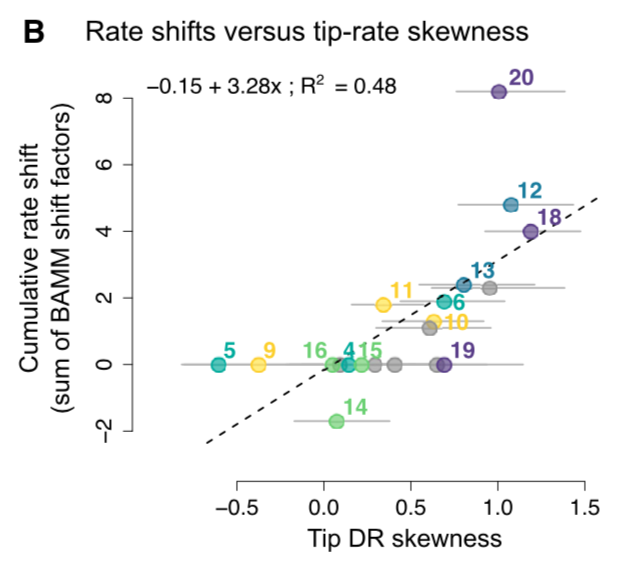
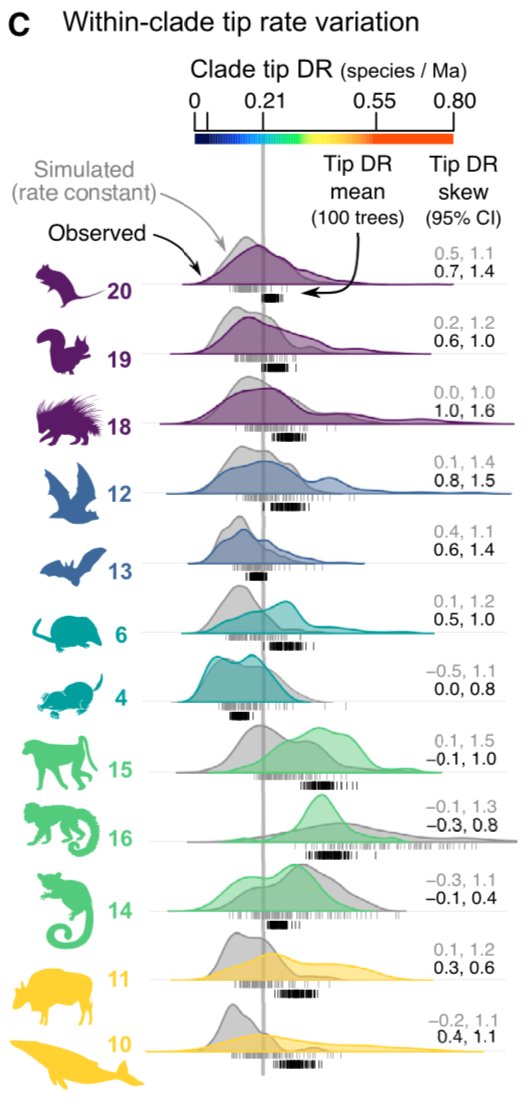
Building on that, we show that skewness in the clade-level distribution of those tip rates carries information about the extent of past rate shifts in that clade (as detected by summing clade rate shifts from BAMM).
This make intuitive sense– tip rates are measuring the per-species branching process, and deviations from that ‘normal’ process will show up as long tails of skewness on the right or left side.
E.g., clade 18 has the tuco-tuco rate shift, and clade 12 the flying fox one.
Overall, students take note: this entire paper grew from “Fig. 2” in our 2020 bioRxiv (biorxiv.org/lookup/doi/10.…) and so is a testament to (a) persistence, & (b) what happens when helpful reviewers ask questions.
Grateful to co-authors @JakeEsselstyn & @walterjetz
🙏🌵🐿️🌒
Also, note our code share via Github here: github.com/n8upham/MamDiv…