Mammalia diversification study goes live on bioArxiv, Twitter
I’m excited to finally share our new study on Mammalia-wide phylogeny and species diversification with a broader audience, which we released as a preprint last week:
The study has been generating a buzz on Twitter, including over 350 re-tweets (4300+ engagements!) on this thread and was the most-read paper on bioArxiv last week. Great to see many people sharing in my excitement about mammal evolution and the potentials for robustly addressing rate-based evolutionary questions with this new supermatrix-based tree of life we generated.
Most importantly, with use of this new tree, we learned several surprising things:
- Speciation rates are a stronger predictor of among-clade richness than clade age, countering claims of clock-like speciation in large phylogenies.
- Speciation rates are surprisingly faster in extra-tropical than tropical lineages, suggesting that longer species durations for tropical lineages underpin the latitudinal diversity gradient in mammals.
- Mammals with low dispersal or that are day-active show the fastest recent diversification, consistent with mechanisms of allopatric speciation and ecological opportunity, respectively.
We conclude that the various diversification processes we detect in our phylogeny of living species are acting on different time scales, and thus leaving different signatures in terms of what species went extinct versus survived. We constrast these processes as ephemeral vs. adaptive diversification, highlighting that while both lead to increases in speciation rates, the former is driven by high turnover (speciation + extinction) while the latter adaptive process would involve lower extinction rates.
Here is Fig. 1 in the main paper, showing species-level relationships and diversification rates across 5911 species of mammals. The branches are colored with tip-level diversification rates (tip DR) and marked with 24 shifts in lineage diversification rates.
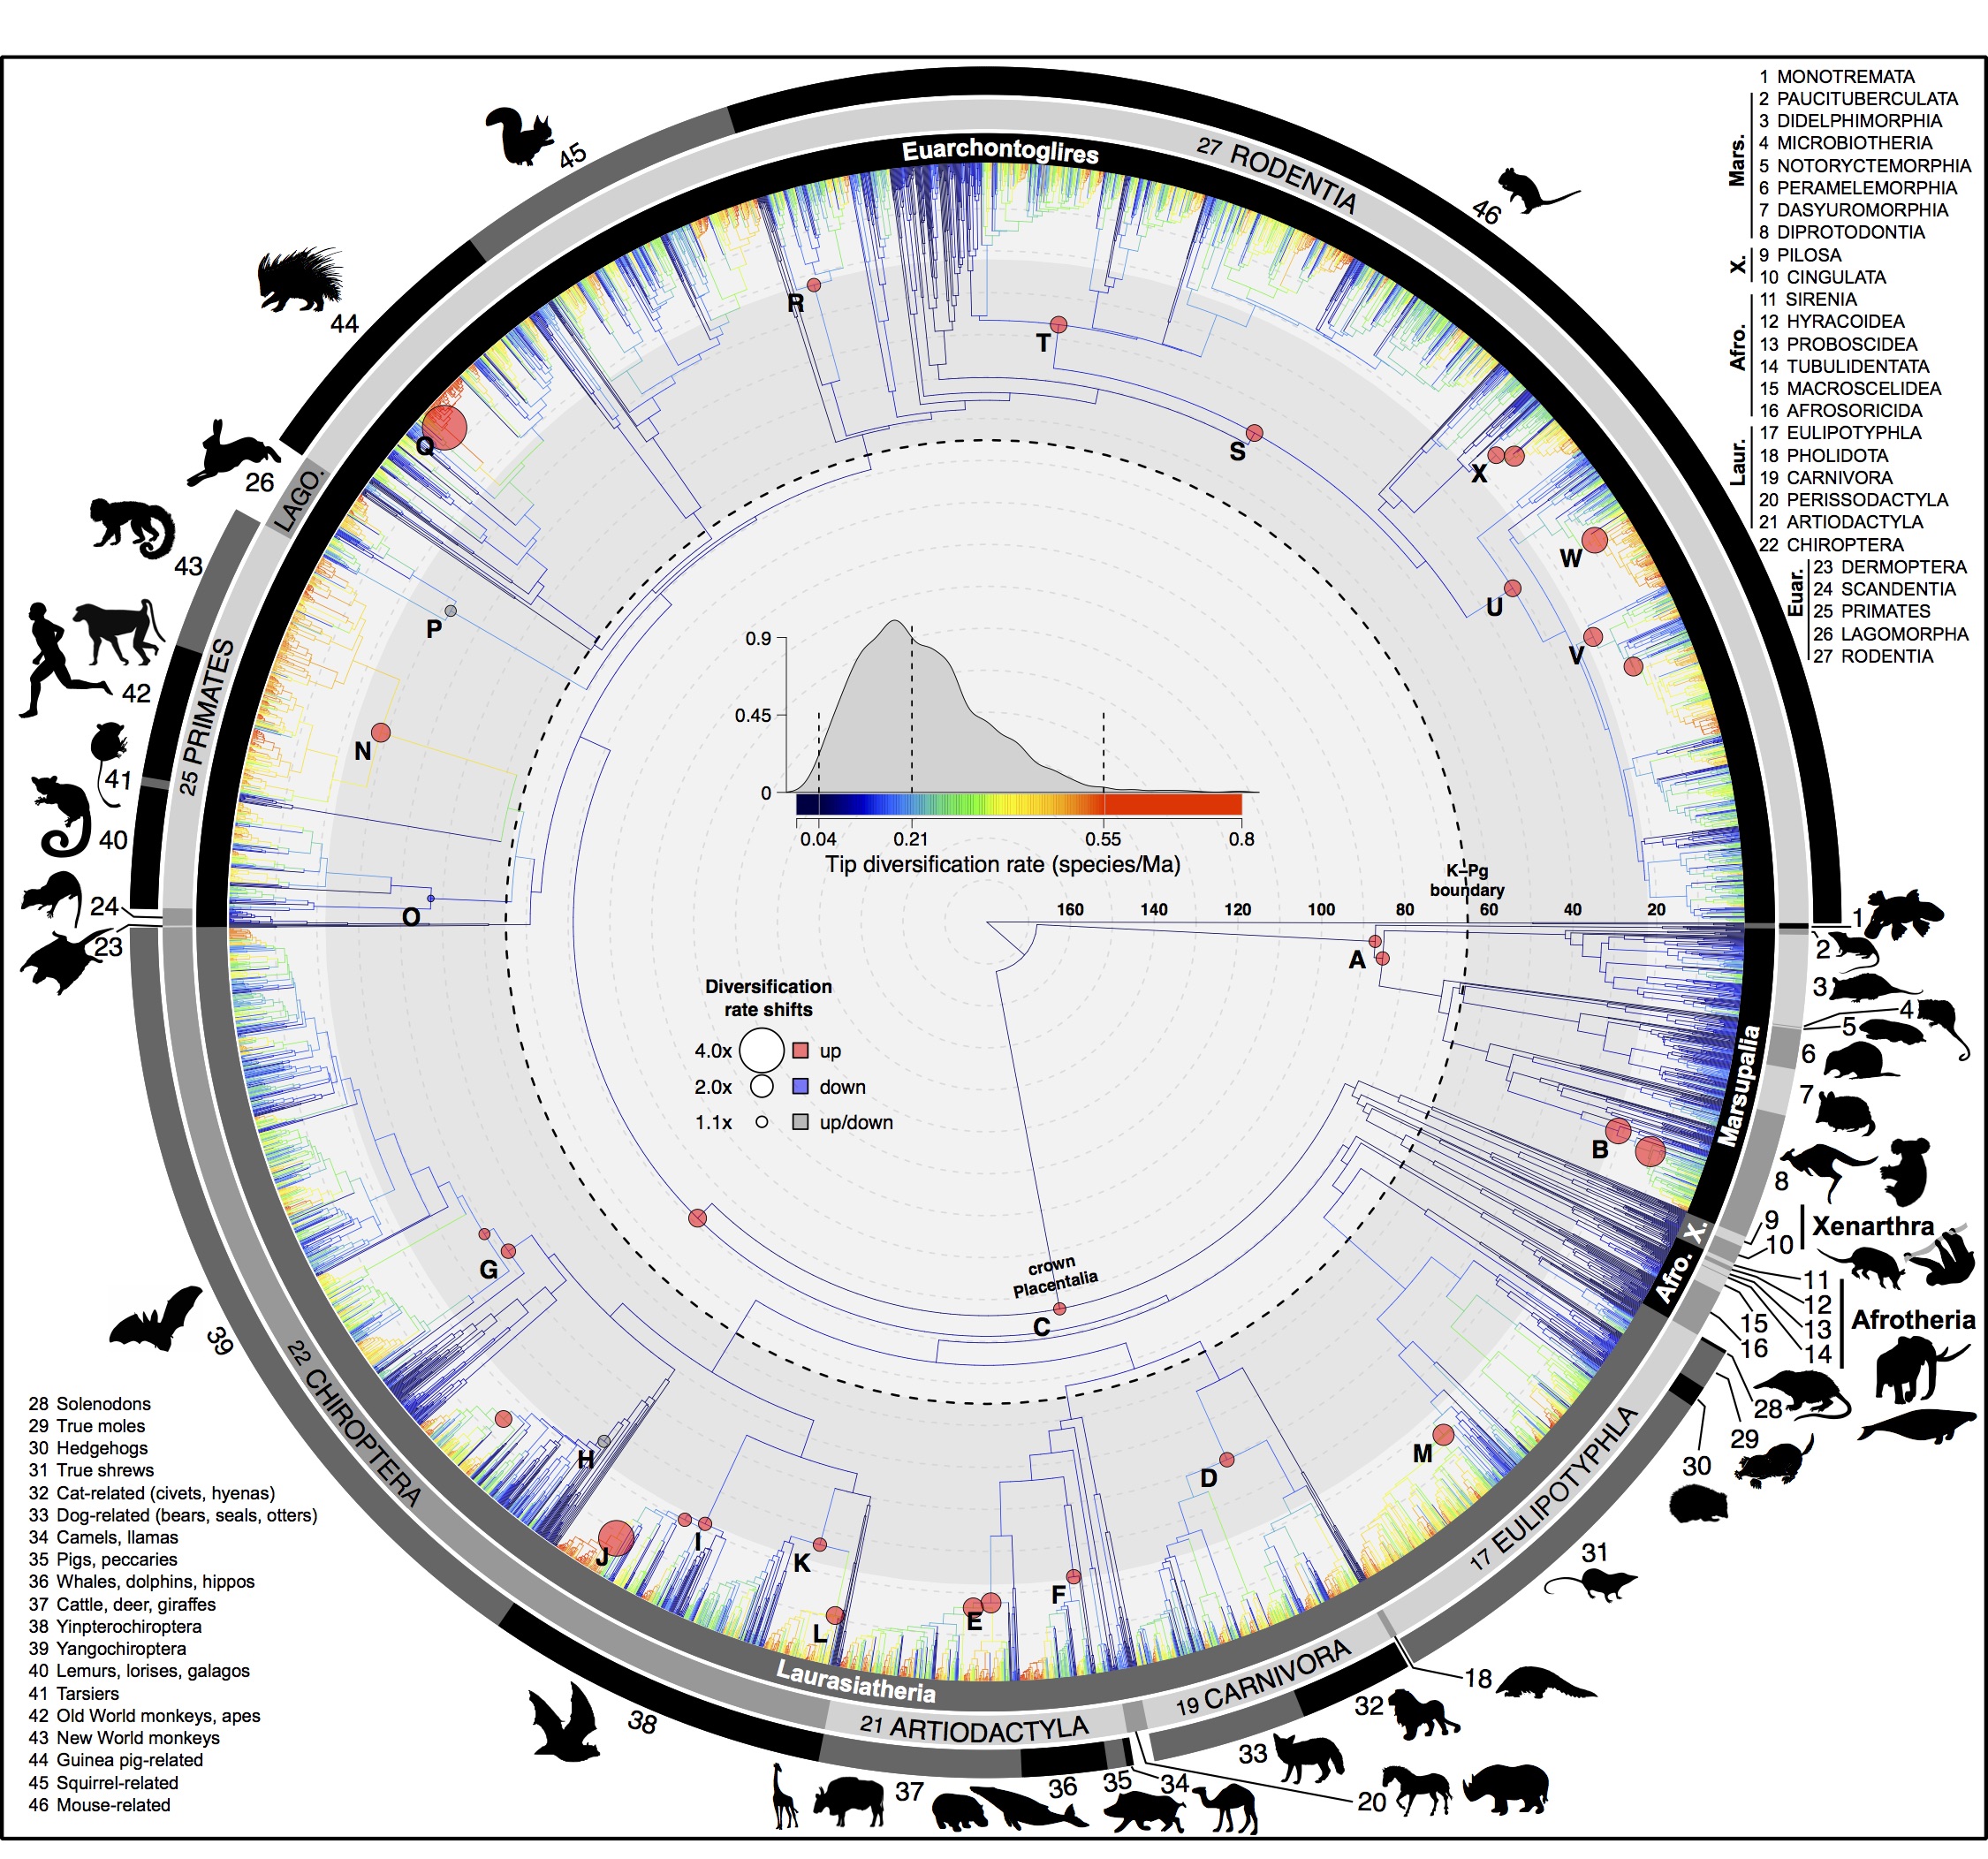
Even more exciting is the ZOOM-IN version of this tree, where the tip labels are visible with “Genus_species_FAMILY_ORDER” tags consistently displayed throughout (Fig S12 in the SI Appendix).
Note that while we cannot release the trees for analysis until the ms is formally published, once published they will be available at http://vertlife.org/phylosubsets/ for subsetting & doing analyses samples of 100-1000 trees (along with birds, sharks, squamates, and amphibians…).
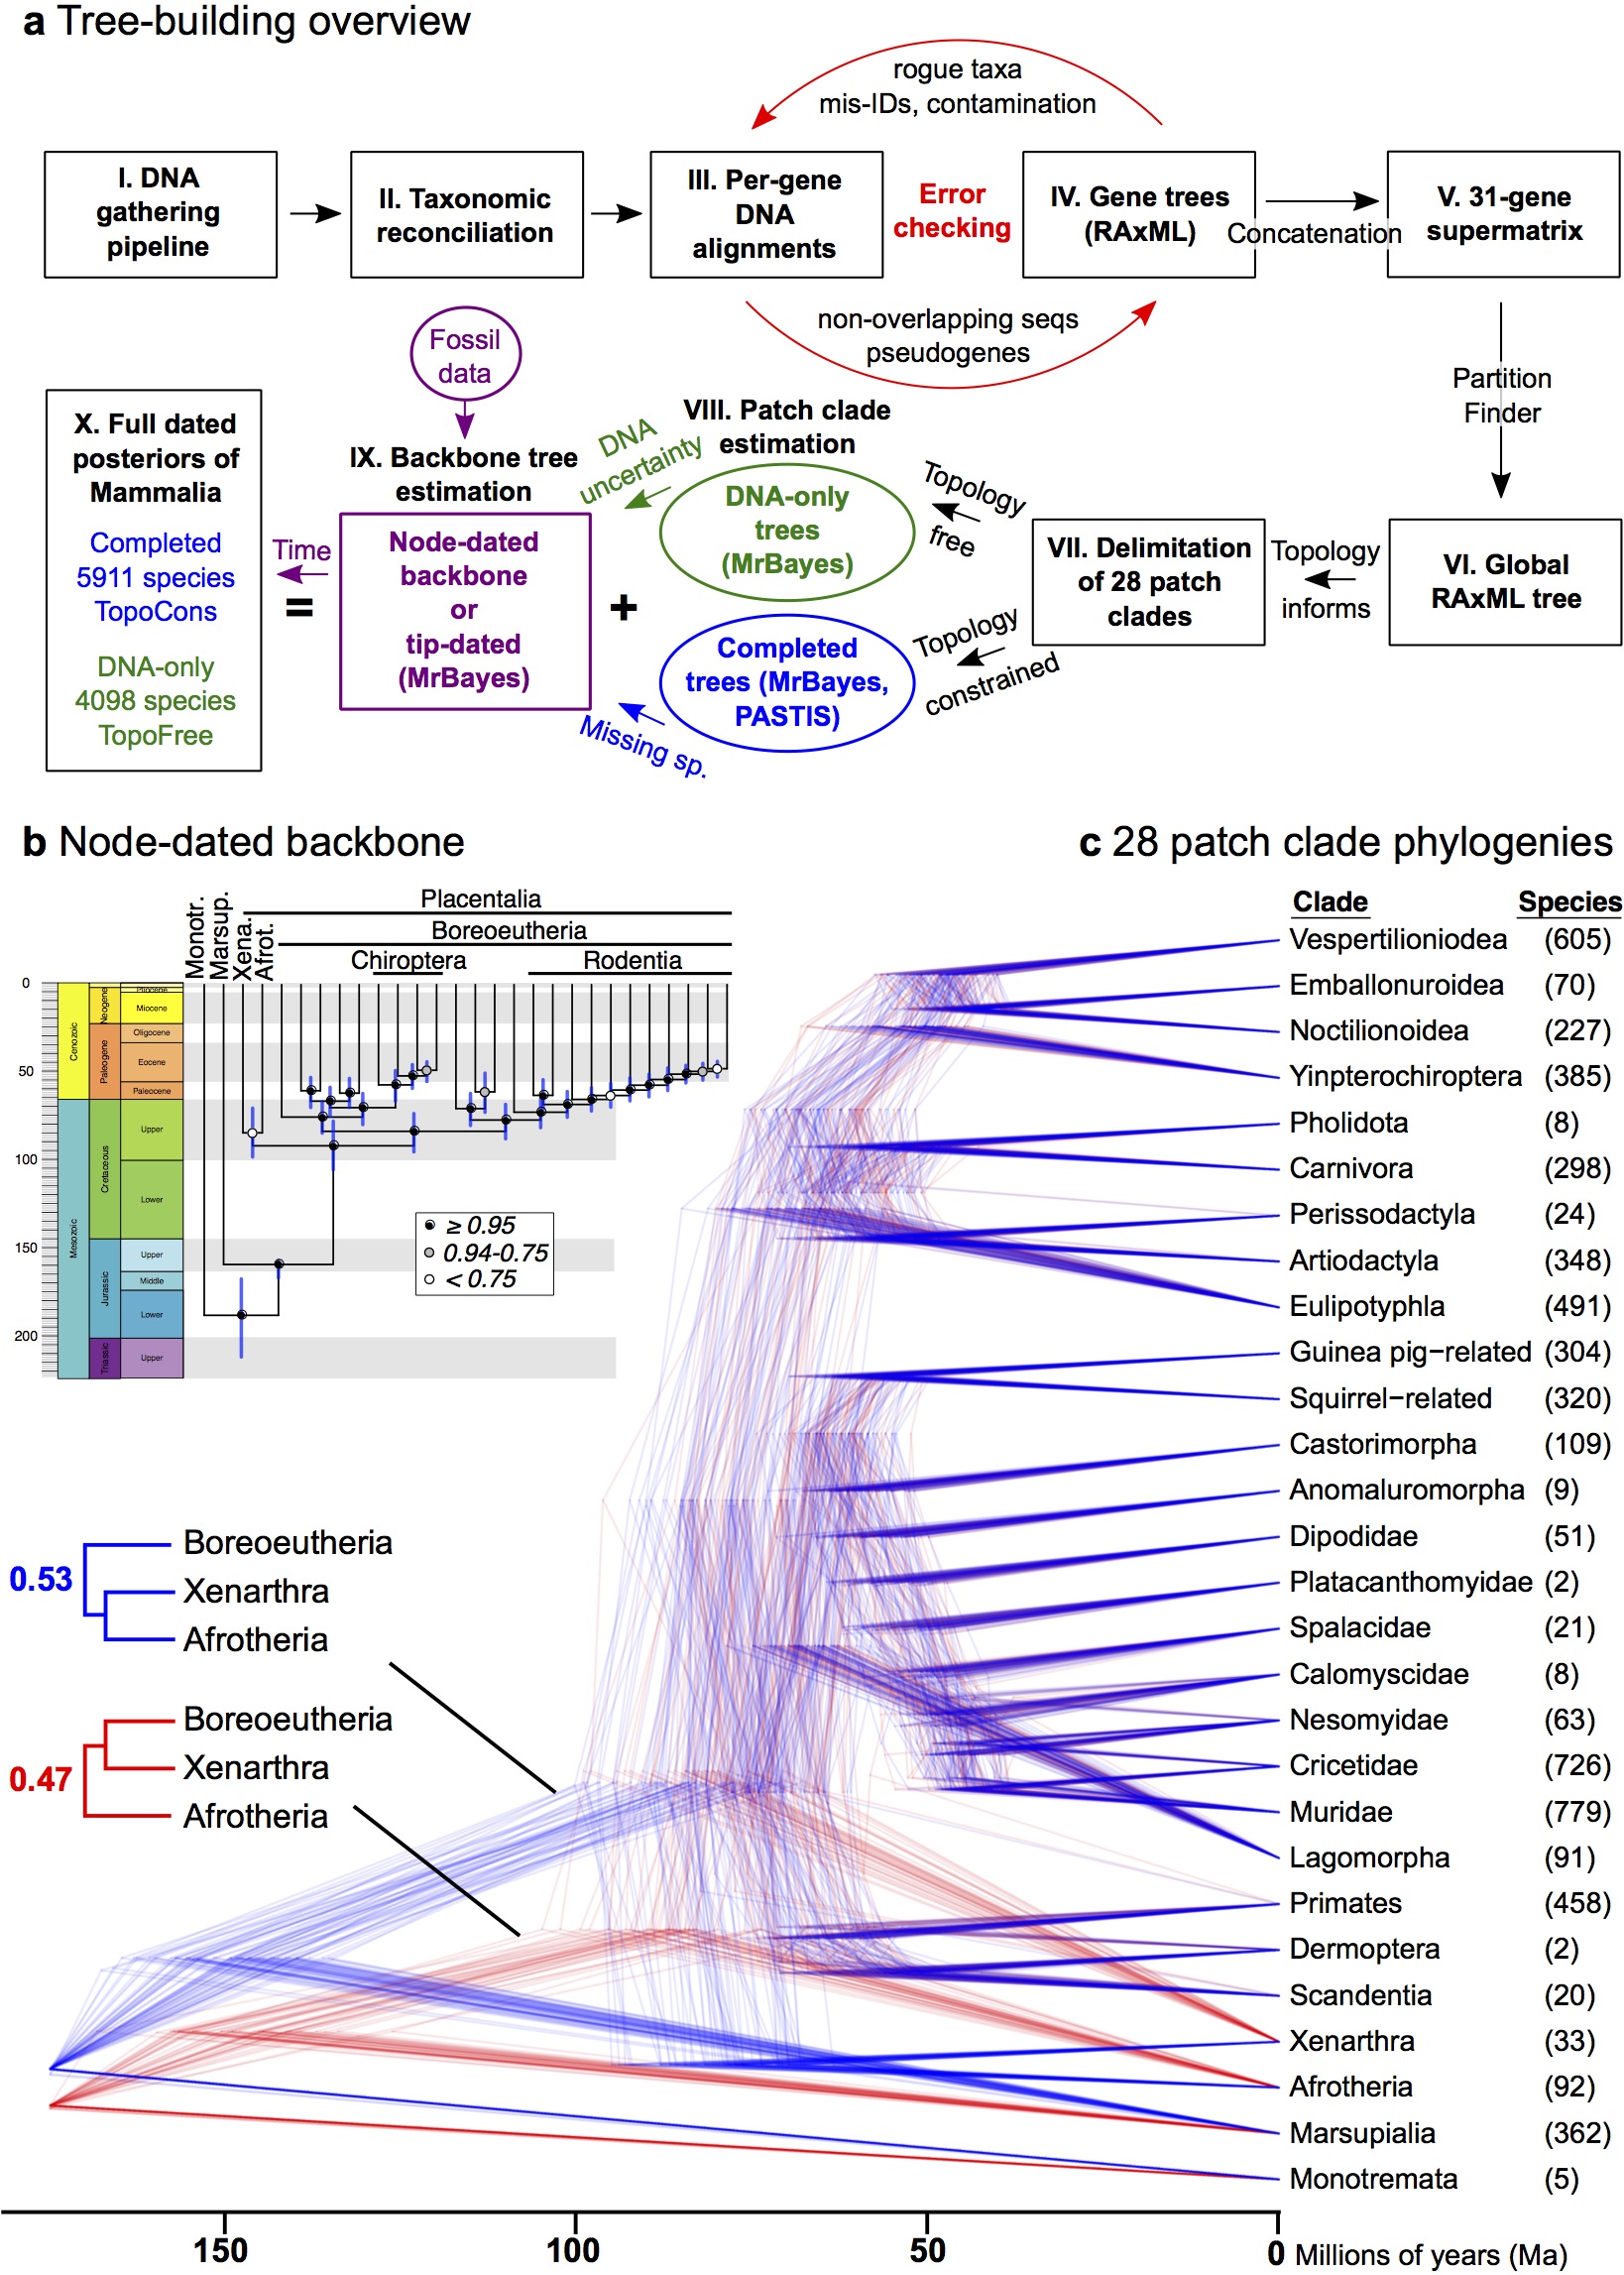
The giant Supplementary Information (94 pages, single spaced) is full of details of our tree-building and analysis methods – below is a key conceptual figure explaining our pipeline. Dig into it!